
The €10,000 communication gap
Picture this: You’re three weeks into a Power BI development project. You’ve crafted DAX measure perfectly, optimized performance, and created what you believe is a technical masterpiece. Then comes the dreaded client meeting.
„This isn’t what we discussed.“
Those five words have cost the industry millions in rework. Most unsuccessful projects fail due to poor requirements management. In Power BI development, this translates to an average of €10,000 in lost time and resources per misaligned project.
I guess this is a lesson that every Power BI developer learned in their project work: The client has a more or less clear vision, you had requirements on paper, but you were building completely different solutions.
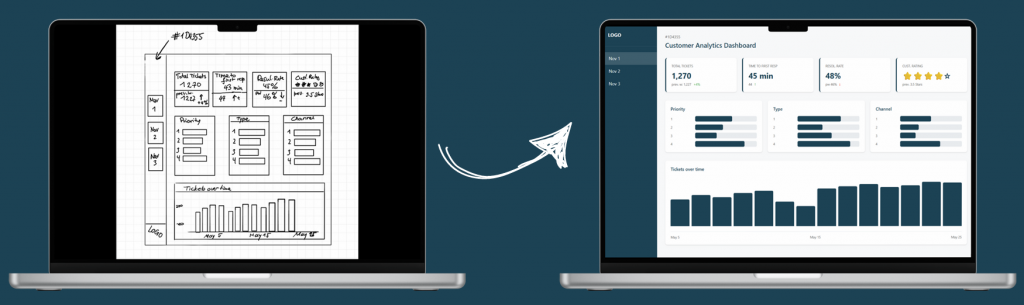
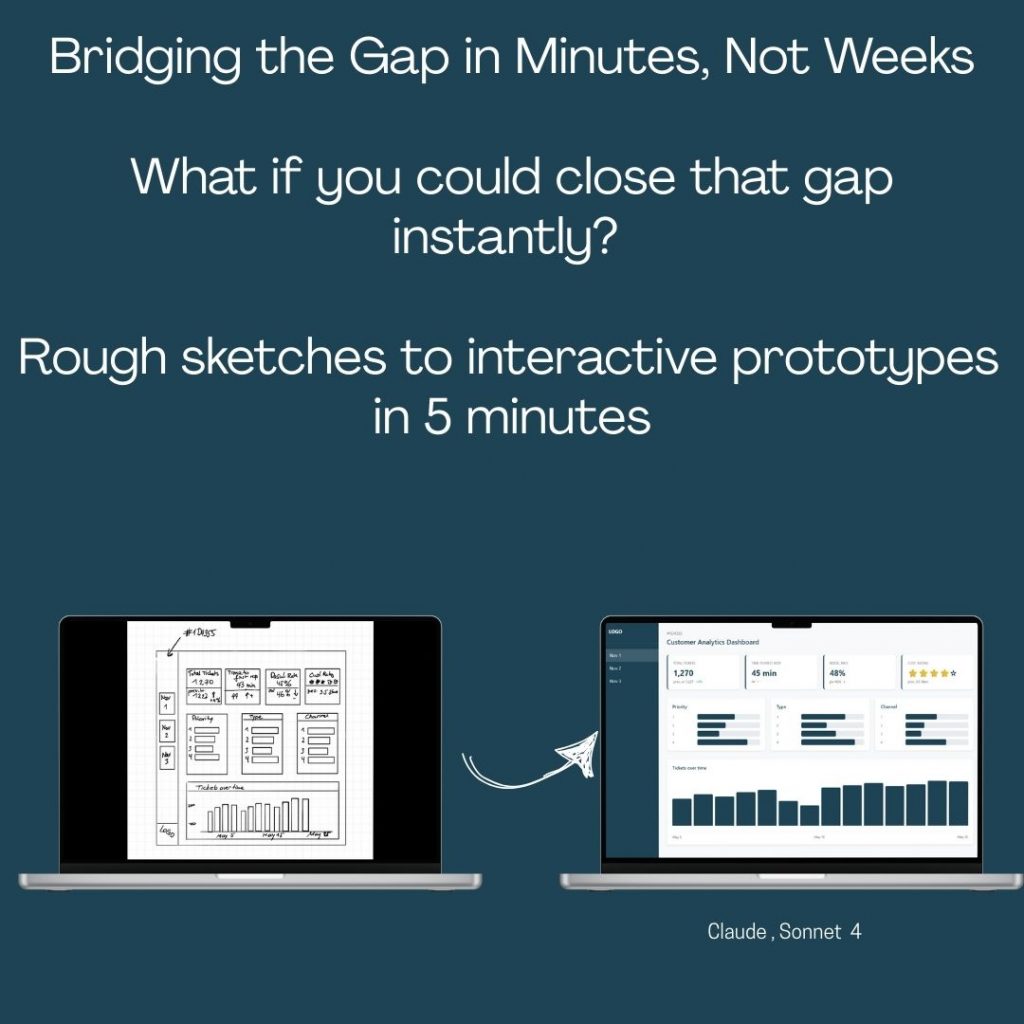
That’s when I tried out LLMs to bridge this communication gap in minutes, not weeks.
Why traditional Power BI development fails
The hidden bottleneck in dashboard projects
After analyzing Power BI projects for more than 6 years, I learned about real problems. The biggest bottleneck isn’t:
 Slow DAX performance
- Data quality issues
- Complex requirements
- Technical limitations
It’s the gap between client vision and developer interpretation.
The typical failure pattern
Here’s how most of problematic projects unfold:
- Great kickoff meeting

- „Clear“ requirements (Actually vague)
- Maybe a rough sketch (Often misinterpreted)
- Weeks of expert development
- Result: Technically perfect but wrong
Cost of this pattern:
- 3-5 revision cycles
- 40+ hours of rework
- Damaged client relationships
- 2-3 week project delays
The 5-Minute AI Mockup Solution
What if you could eliminate miscommunication (almost) entirely?
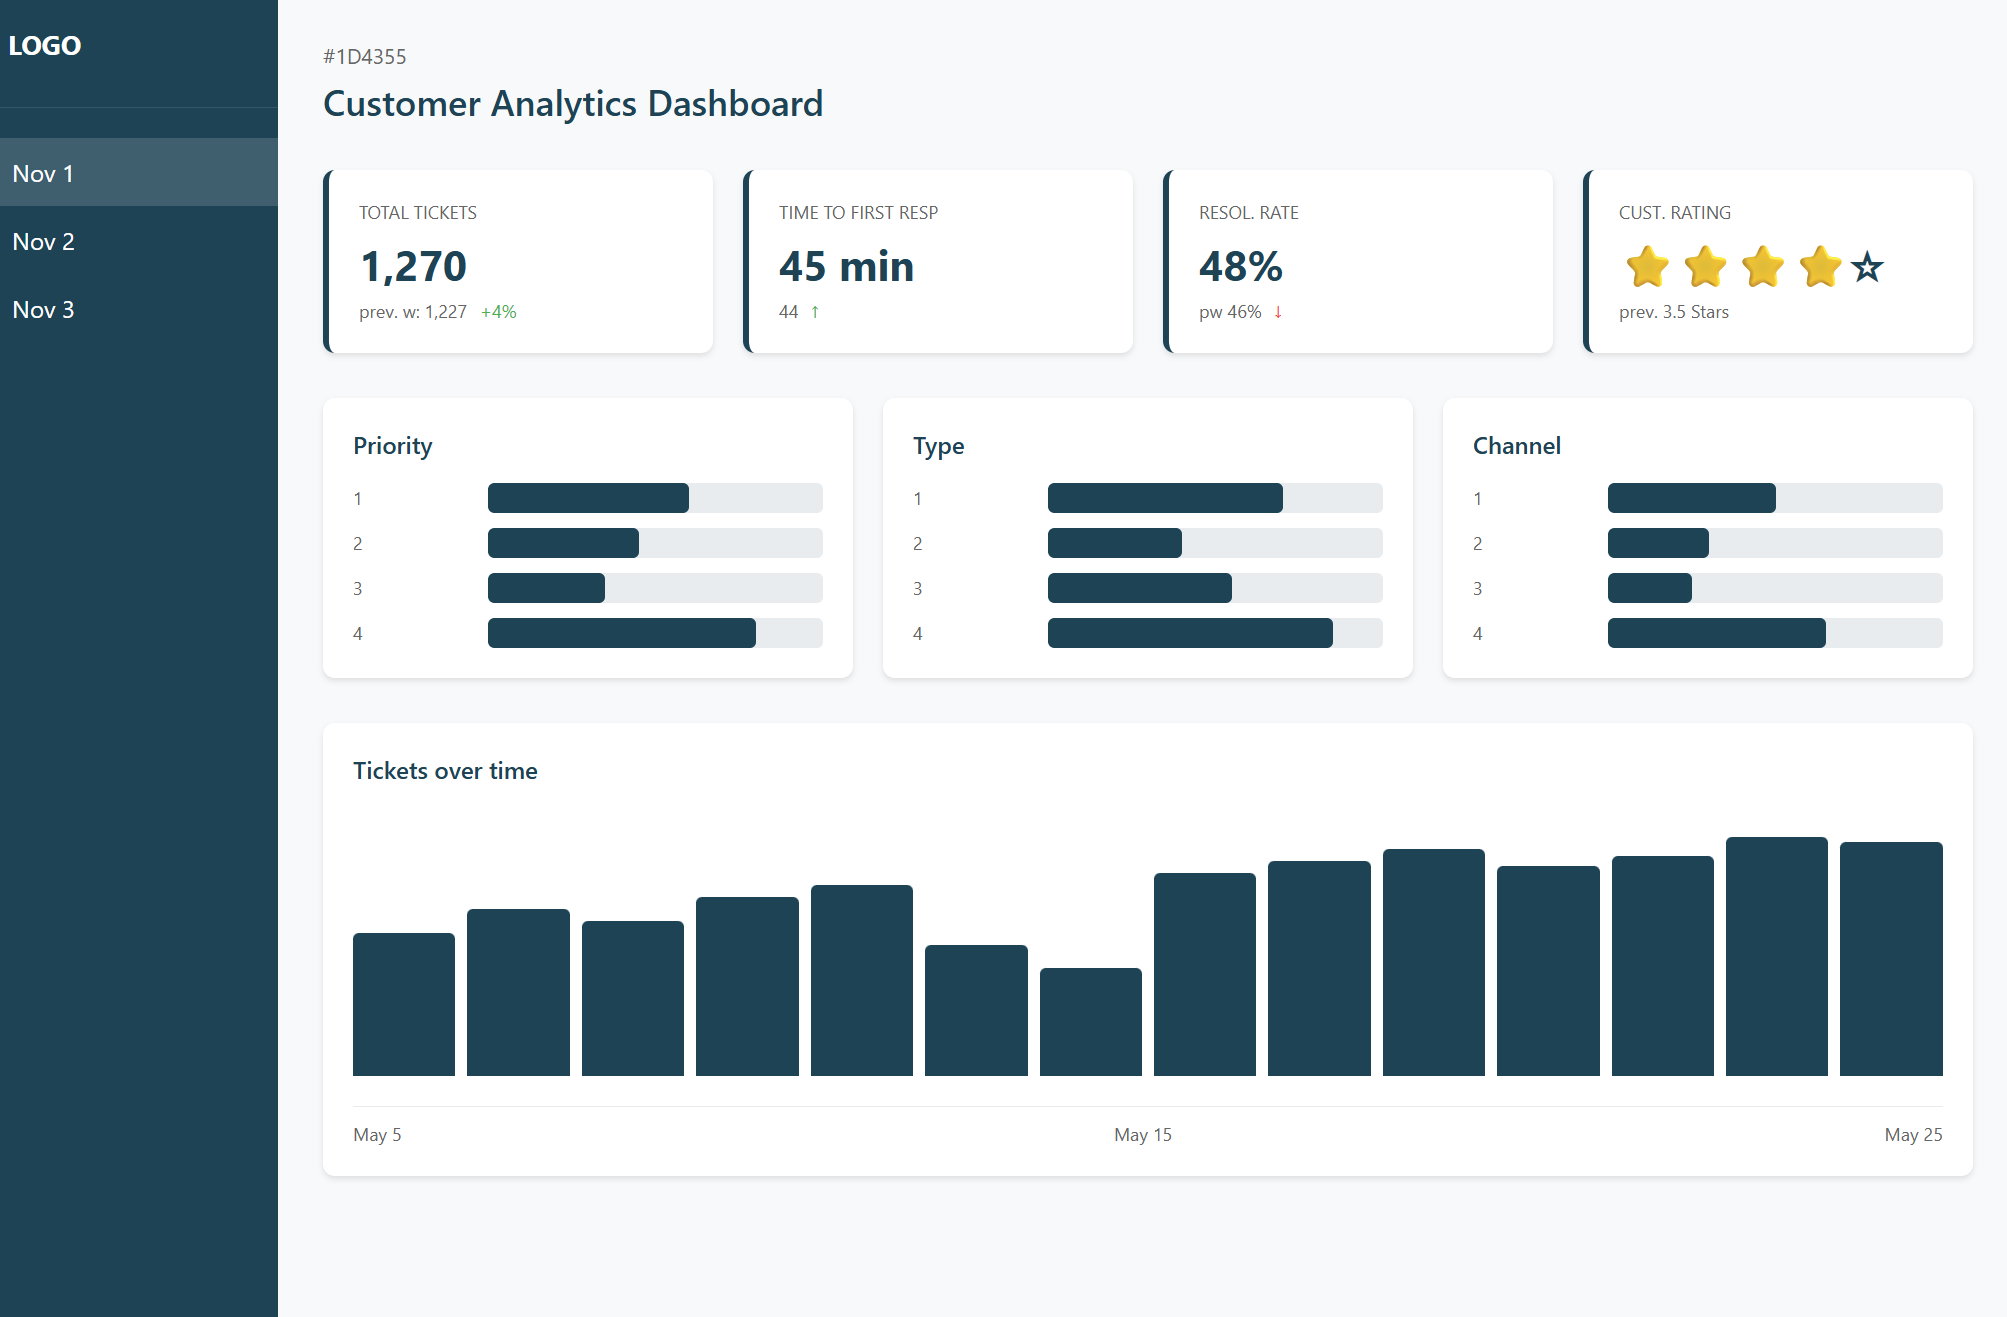
In the last weeks I optimized my approach to this problem: with the right prompts and some very important ingredient, i.e. hand-drawn sketches, you can create interactive HTML prototypes in under 5 minutes. Not static mockups or PowerPoint slides—fully clickable dashboards that clients can test and approve before development begins.
The Results speak for themselves
Before AI Prototyping we often saw several major revisions per project, as well as long client approval times. After AI Prototyping the revisions were reduced by a tremendous amount and you get an approval to build the dashboard almost always the same day.
Step-by-Step Power BI Prototyping Process
Step 1: Create your Power BI sketch (1 minute)
Tools needed:
- Pen and paper (or digital tablet like reMarkable)
- Basic layout understanding
What to include:
- KPI card positions
- Chart locations and types
- Navigation structure
- Key data elements
Pro tip: Don’t be afraid of messy sketches – they work great!
Step 2: Choose your preferred LLM (30 seconds)
This works with all LLMs currently on the market, I tried Claude, OpenAI and Gemini
Pro Tip: Instead of paying $20/month for each AI service, use OpenRouter.ai – one platform that gives you access to 400+ AI models with pay-as-you-go pricing.
| Platform | Access | Cost Model | Benefits |
|---|---|---|---|
| OpenRouter.ai | 400+ models | Pay-per-use | Test multiple models, no subscriptions |
| Individual Services | Single model | $20/month each | Limited to one provider |
OpenRouter.ai Advantages:
- No commitment – minimum $5 credit (valid 1 year)
- Compare models side-by-side for same prompt
- Access latest models from all providers
- Unified API for all models
Best Models for Power BI Mockups:
- Claude Sonnet 4: Most accurate layouts, best design sense
- GPT-5: Good alternative, slightly more verbose
- Gemini 2.5 Pro: Budget-friendly, detailed explanations
Recommendation: Start with OpenRouter.ai and test Claude Sonnet 4, GPT-5, and Gemini 2.5 Pro with the same prompt to see which works best for your style.
Step 3: Apply the prompt template (2 minutes)
My role: Power BI Developer
Objective: I need a dashboard mockup as an interactive click dummy for [SPECIFIC DOMAIN] analytics

Relevant Layout Information:
Pages: [NUMBER] (1- overview, 2- details on [TOPIC], 3- details on [TOPIC])
Navigation: [left sidebar/top tabs/breadcrumbs]
Main Color: [HEX CODE] (e.g., #1D4350)

Layout: [NUMBER] sections horizontally split:
1: KPI cards with references (prev. year): [SPECIFIC METRICS with example values]
2: [NUMBER] bar charts with [SPECIFIC CATEGORIES] on Y axis and [METRICS] on X axis
3: [CHART TYPES] showing [SPECIFIC DATA]

Design: Clean and lean, omit clutter, provide more information on hover, use color sparingly
Size: 16:9 format, landscape
Data Context: [SPECIFIC INDUSTRY/USE CASE with realistic sample data]

Additional Requirements:
- Interactive hover states
- Responsive design
- Professional typography
- Subtle animations on click
Step 4: Generate and review (2 minutes)
The LLM produces:
- Fully functional HTML prototype
- Clickable navigation elements
- Hover effects and interactions
- Professional styling
- Mobile responsiveness
Step 5: Client Iteration
Magic moment: Client clicks through and says „Yes, exactly this.“
📹I also made a video about it: See, how this is done (link to youtube).
Example success stories
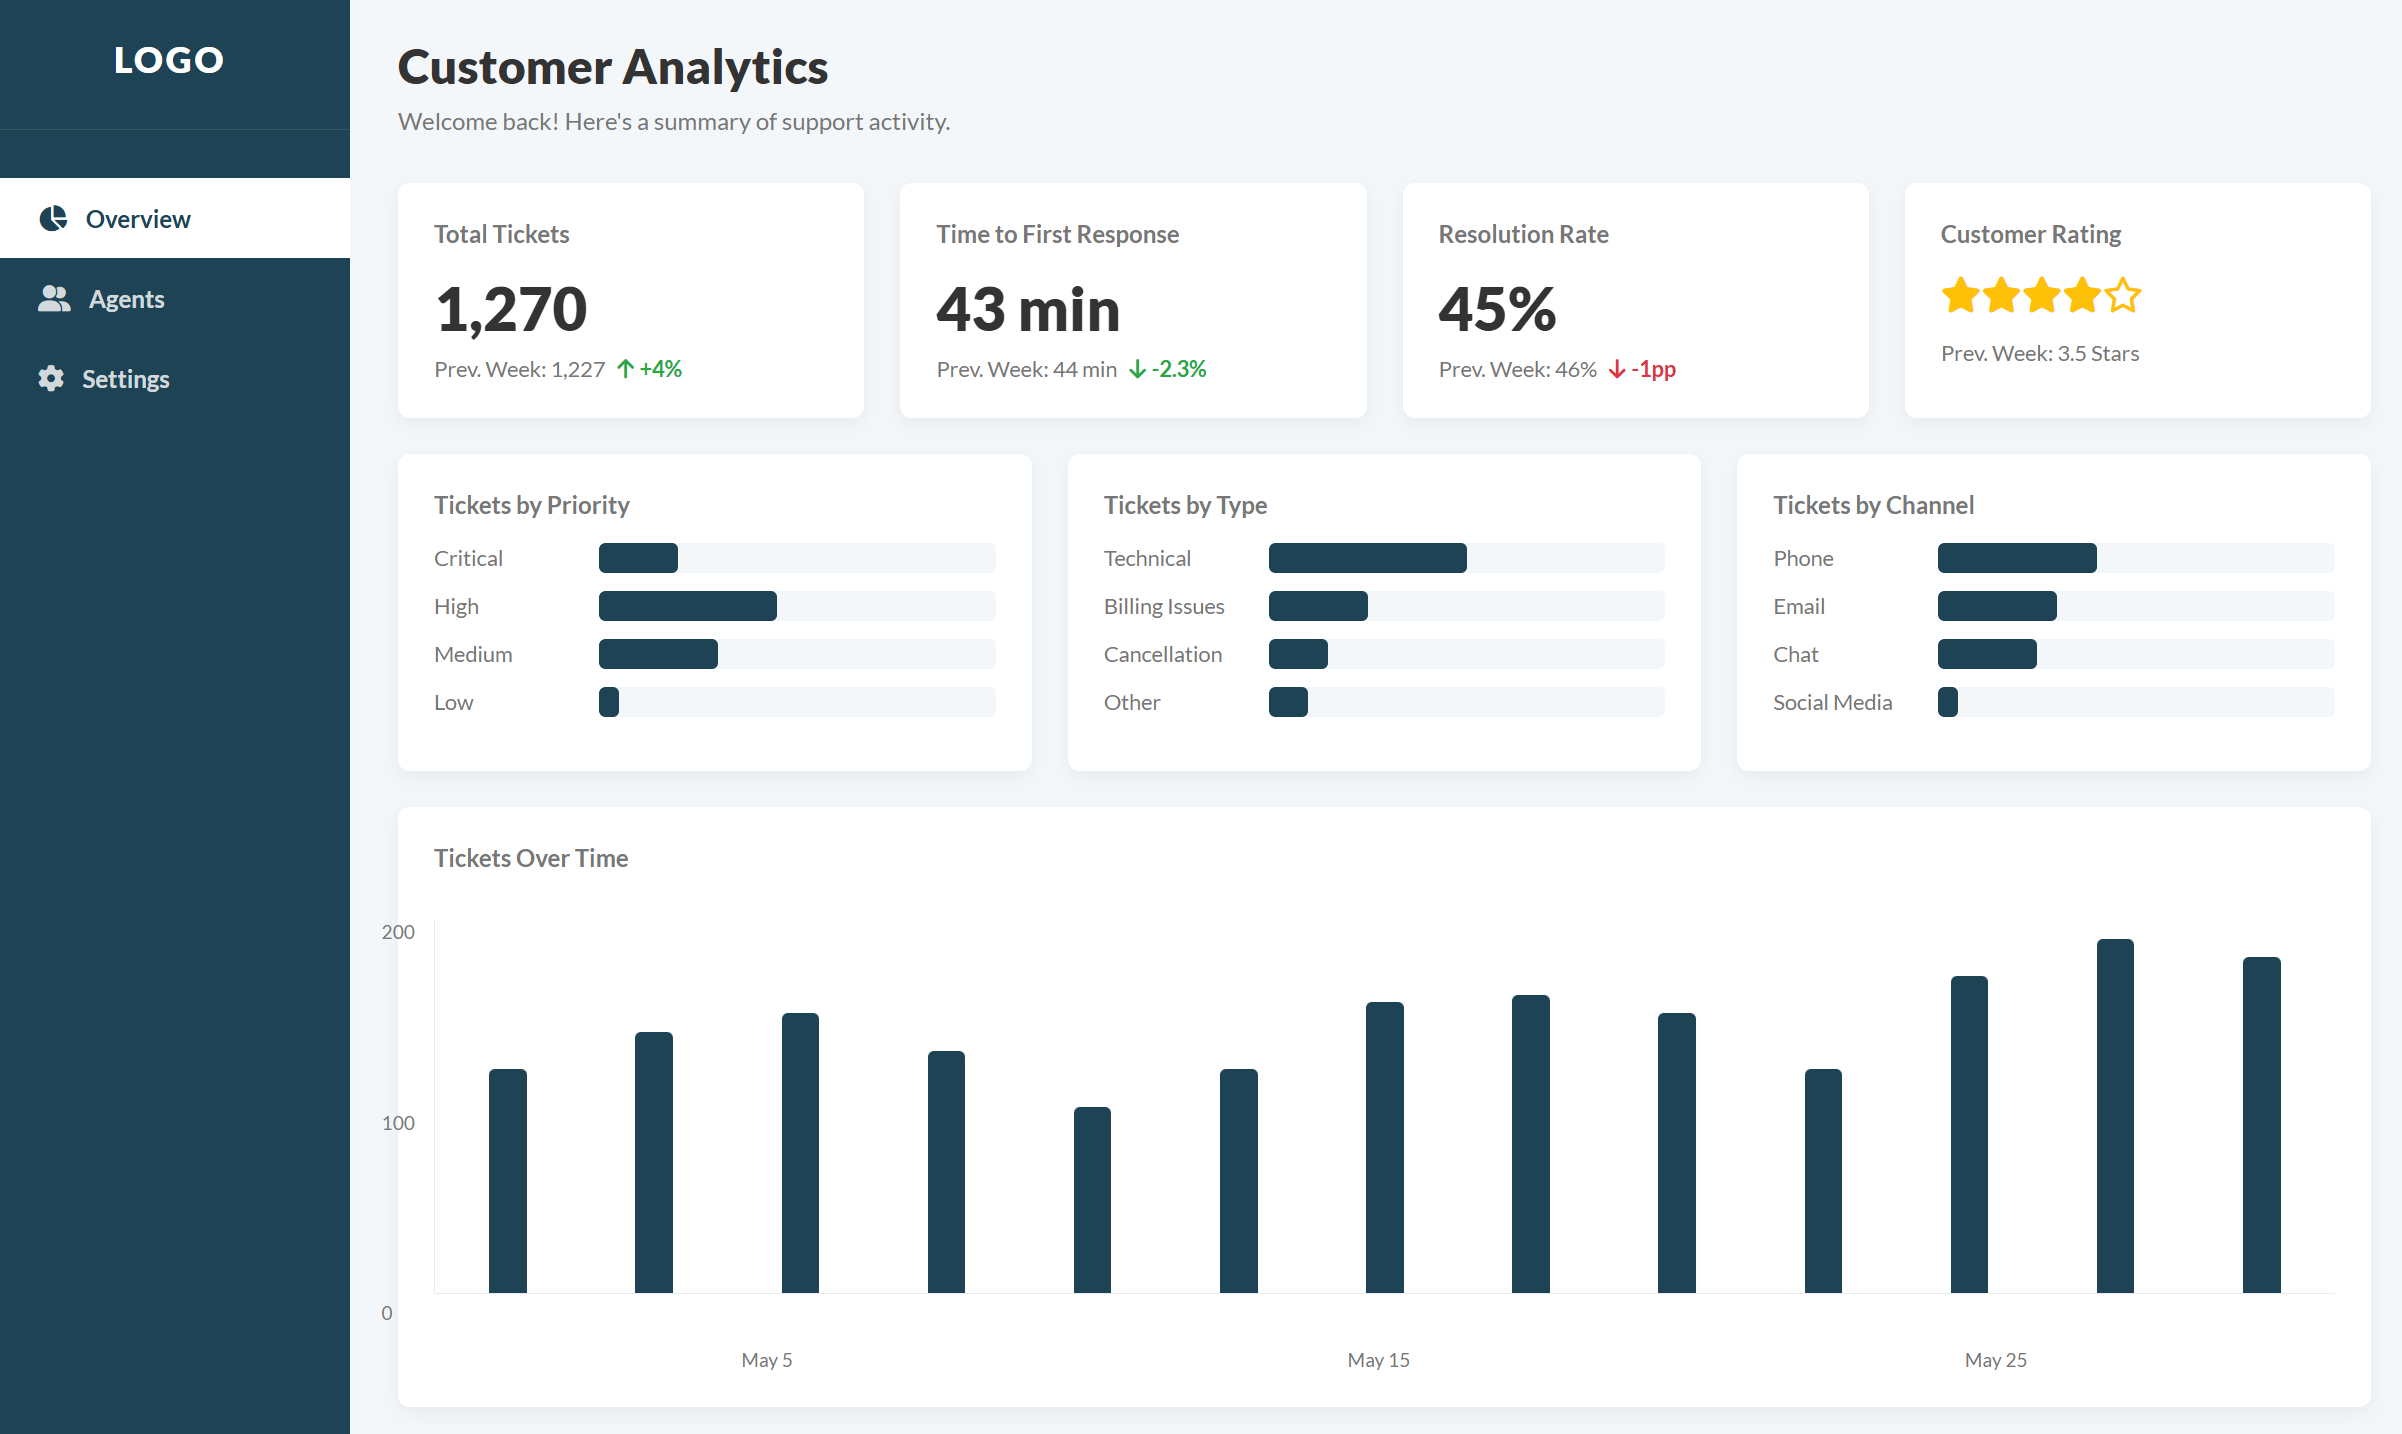
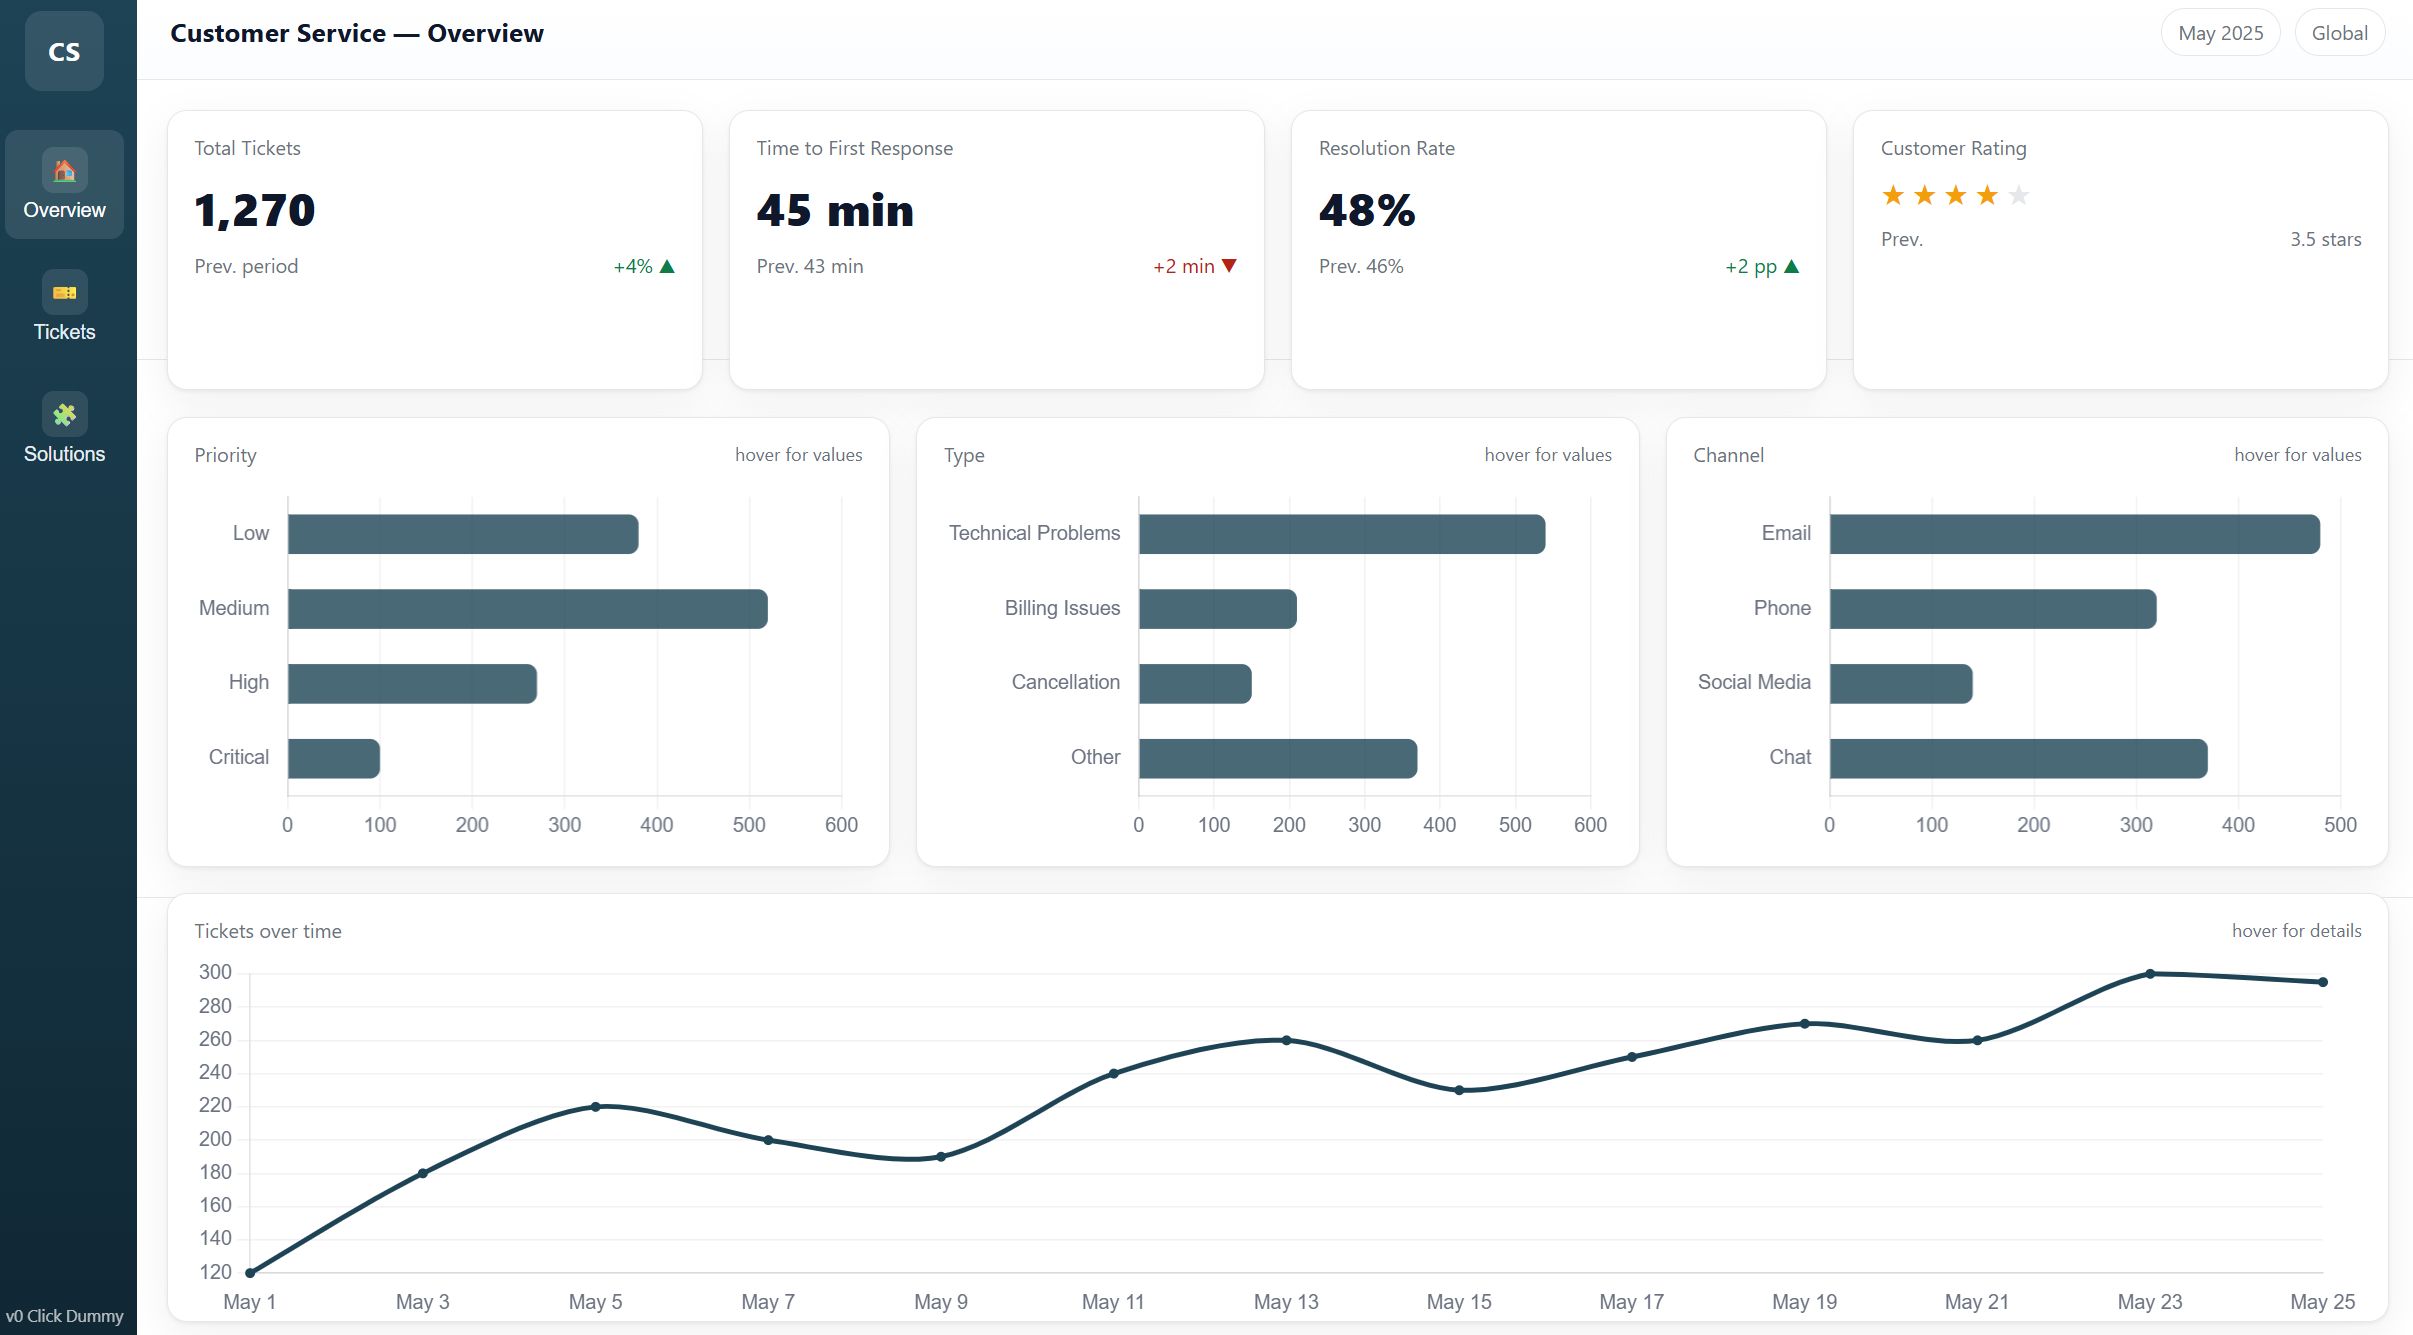
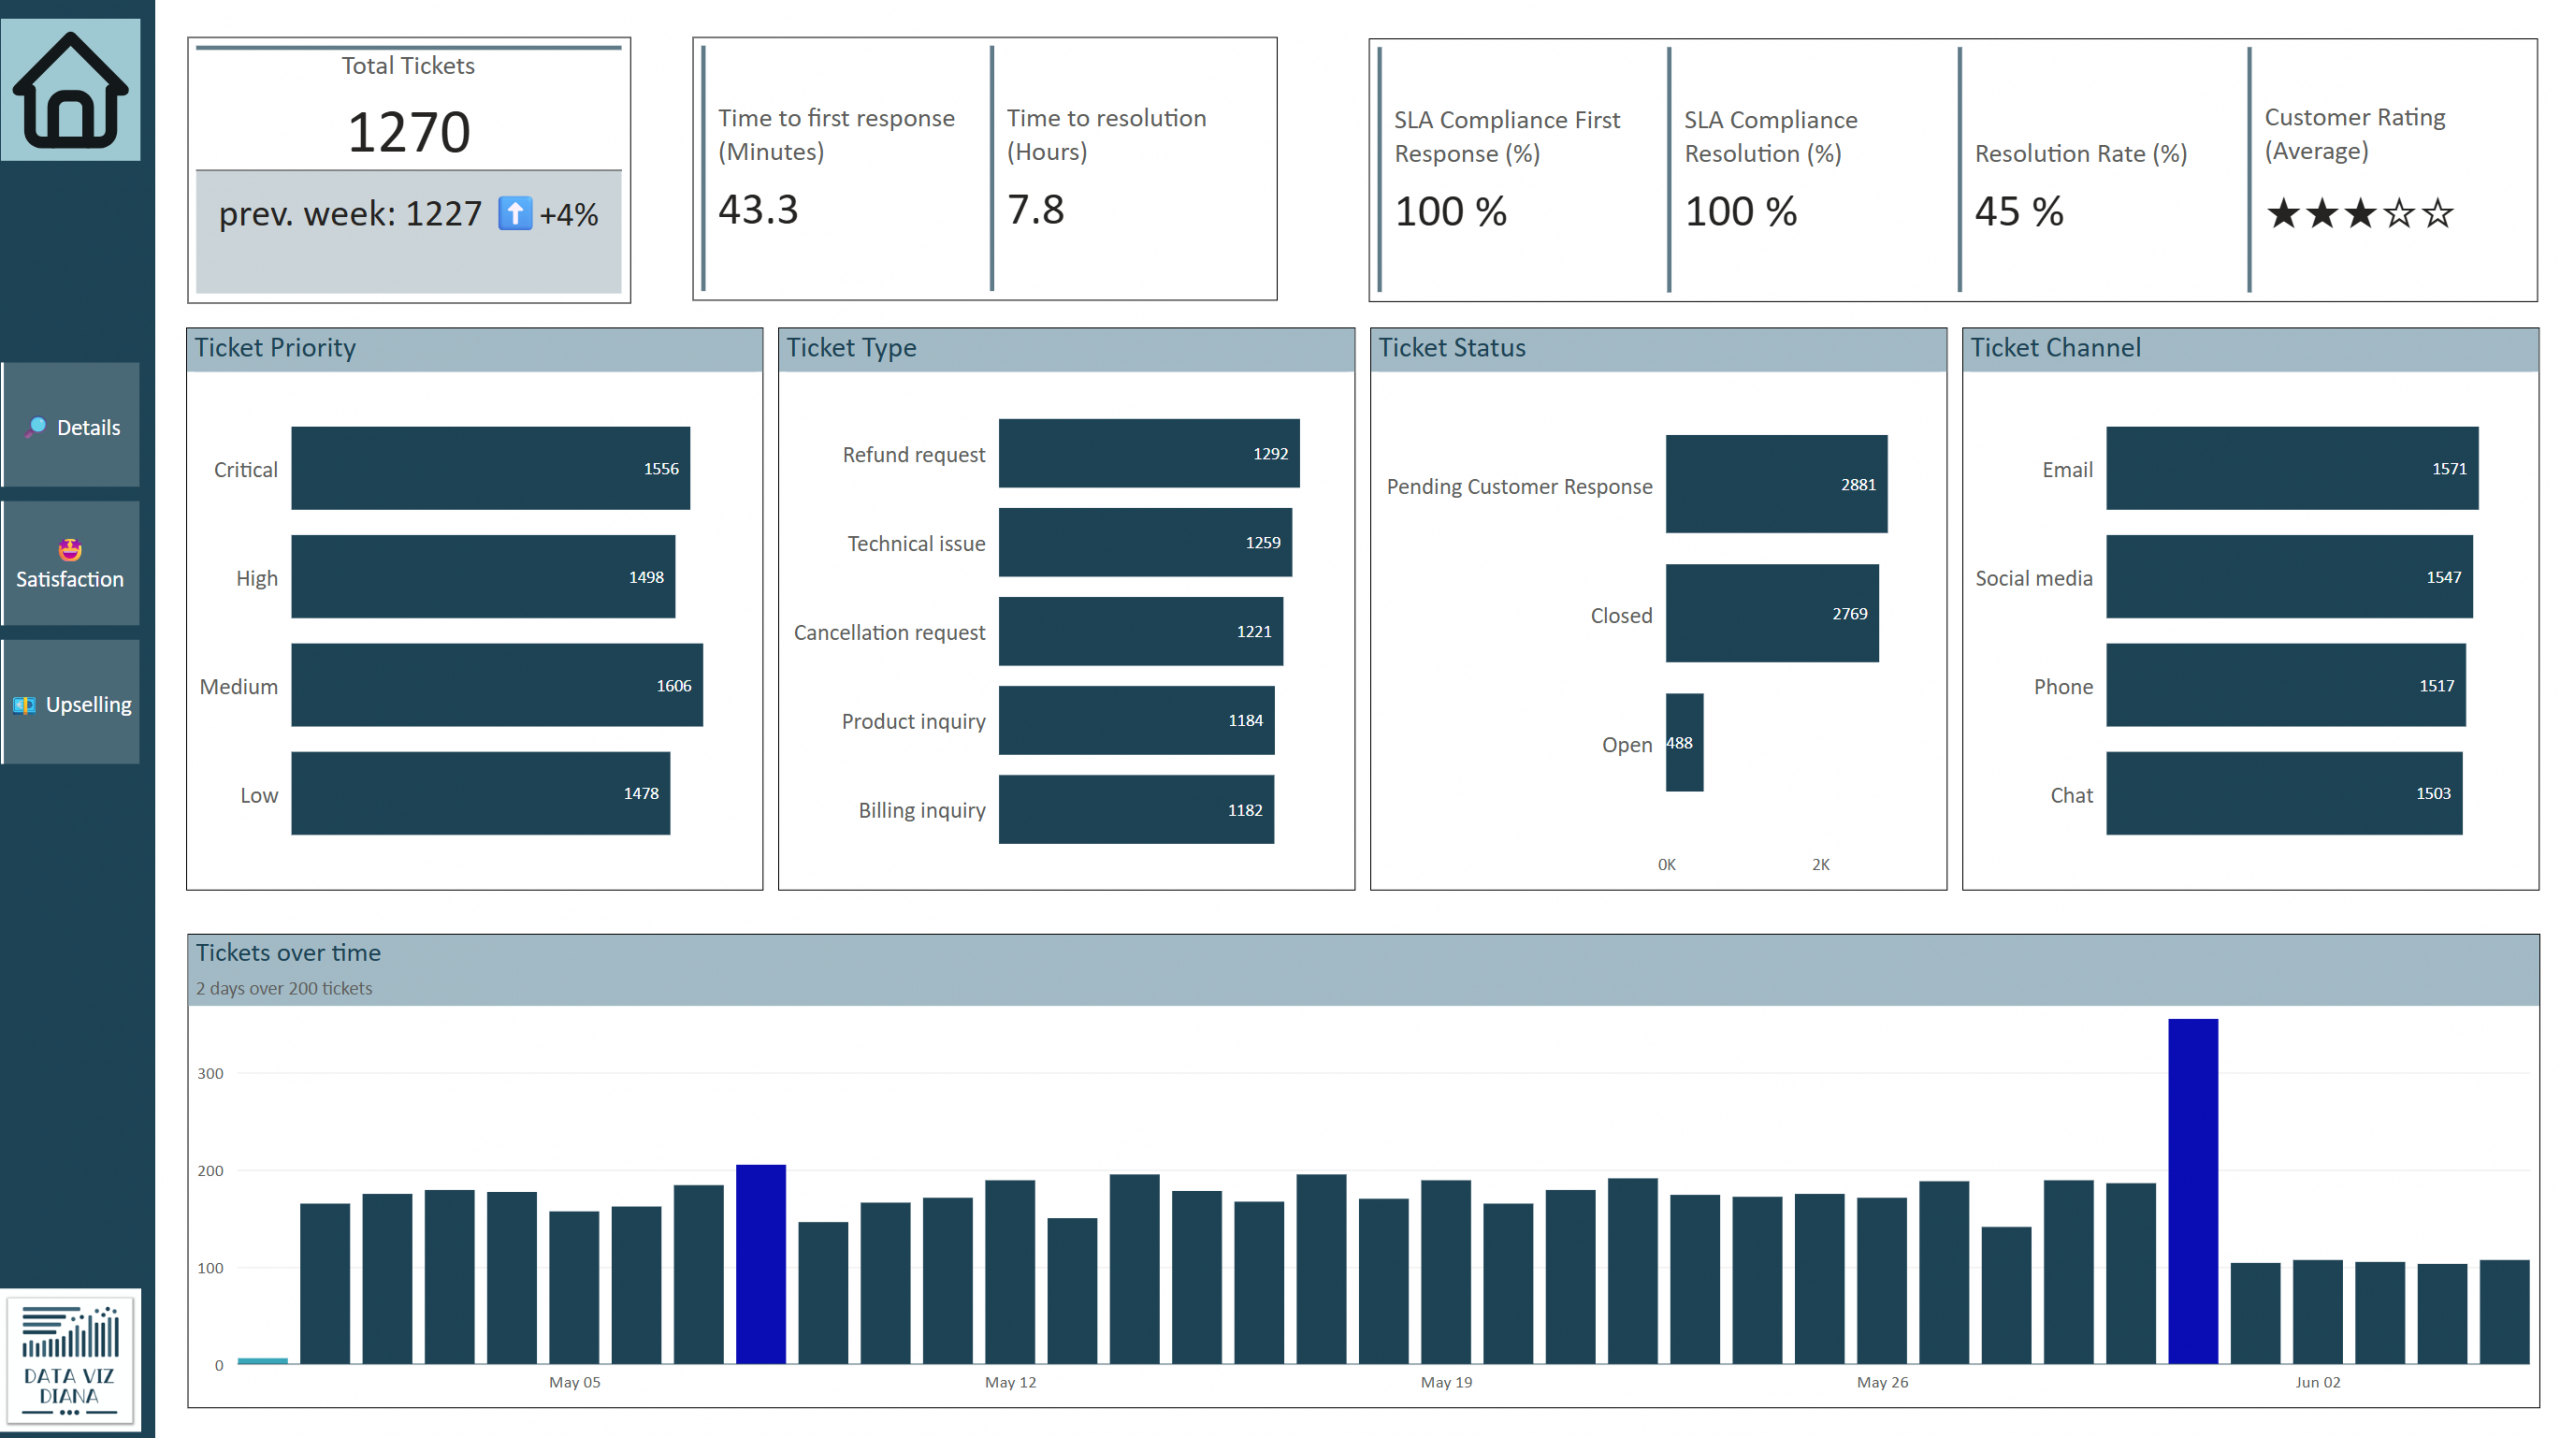
Case Study 1: Customer service analytics dashboard
Client: Call center Challenge: Executive dashboard for customer service analytics Timeline: 2-day turnaround required
Traditional approach would have taken: 2 weeks AI mockup approach: 4 hours total
Results:
- Approved in first meeting
- Zero major revisions required
- Deployed in time
- Client testimonial: „Most accurate initial prototype we’ve ever seen“
Let’s see some examples:
Troubleshooting Common Issues
Problem 1: Generic Layout Output
Symptoms: AI produces basic grid layouts with pie charts
Root cause: Insufficient layout specification
Solution: Include detailed sketch and positioning requirements
Problem 2: Unrealistic Data
Symptoms: Generic „Sample Data“ labels
Root cause: No data context provided
Solution: Include project-specific examples
 Bad: "Sales data"
 Good: "Q4 Revenue: $2.4M (↑12% vs Q3), Units Sold: 15,670 (↓3% vs Q3)"
Problem 3: Off-Brand Design
Symptoms: Colors and fonts don’t match company standards
Root cause: Missing design specifications
Solution: Include some brand guidelines
Add: "Primary: #1D4350, Secondary: #F39C12, Font: Segoe UI, Logo placement: top-left"
Quick Fix Checklist
- [ ] Sketch uploaded and referenced
- [ ] Specific data examples included
- [ ] Brand colors specified (hex codes)
- [ ] Interactive requirements listed
- [ ] Project context provided
- [ ] Layout positioning detailed
ROI Calculator: Time and Cost Savings
Traditional Power BI Development Process
| Phase | Time | Cost* | Risk |
|---|---|---|---|
| Requirements gathering | 4 hours | €400 | High miscommunication |
| Initial development | 40 hours | €4,000 | Wrong direction |
| Client review | 2 hours | €200 | Major revisions |
| Revision cycle 1 | 16 hours | €1,600 | Still misaligned |
| Revision cycle 2 | 12 hours | €1,200 | Getting closer |
| Final approval | 2 hours | €200 | Finally approved |
| Total | 76 hours | €7,600 | High stress |
*Based on €100/hour developer rate
AI-Powered Mockup Process
| Phase | Time | Cost* | Risk |
|---|---|---|---|
| Sketch creation | 0.5 hours | €50 | Low |
| AI mockup generation | 0.5 hours | €50 | Minimal |
| Client review & approval | 0.5 hours | €50 | Very low |
| Development (aligned) | 40 hours | €4,000 | Minimal |
| Total | 41.5 hours | €4,150 | Low stress |
Your Savings Calculator
Time saved per project: 34,5hours (45% reduction)
Cost saved per project: €3,450 (45% reduction)
Stress reduction: Immeasurable
Annual impact (10 projects):
 345 hours saved (9 weeks)
 €34,500 cost reduction
 97% client satisfaction vs 68%
Frequently Asked Questions
How to Get Started with Power BI AI Mockups
Q: Do I need coding skills to create AI mockups? A: No coding required. The AI generates all HTML/CSS/JavaScript automatically. You just need to sketch and prompt effectively.
Q: Which AI tool works best for Power BI prototyping? A: OpenRouter.ai gives you access to all models for testing. Claude Sonnet 4 typically provides the best results for professional dashboard mockups.
Q: How accurate are AI-generated Power BI mockups? A: With proper prompting, 95%+ layout accuracy. The key is detailed sketches and specific data context.
Power BI Mockup Best Practices
Q: Should I show mockups to clients before starting development? A: Absolutely. This is the core value—getting approval before any development work begins.
Q: Can AI mockups handle complex Power BI features like drill-through? A: Yes, but you need to specify the navigation flow in your prompt. Include page relationships and interaction requirements.
Q: How do I handle client changes to the mockup? A: Minor changes take 30 seconds to regenerate. Major changes might need a new prompt, but still faster than code revisions.
Technical Implementation Questions
Q: Can I use the HTML mockup as a starting point for actual Power BI development? A: The mockup serves as a visual reference. You’ll still build the actual dashboard in Power BI Desktop, but with perfect clarity on requirements.
Q: What if my client wants changes after seeing the mockup? A: This is the goal! Better to change a 5-minute mockup than a 3-week dashboard. Iterate until perfect, then develop.
Q: How do I handle sensitive client data in mockups? A: Use realistic but fictional data. Never upload actual client data to AI tools. Create representative samples for the mockup.
Business and ROI Questions
Q: How much can I save per Power BI project? A: Average savings: 50+ hours and $5,000+ per project. See our ROI calculator above.
Q: Will clients pay extra for mockup services? A: Many developers charge 10-15% premium for „prototype-first“ development due to higher success rates and faster delivery.
Q: Can this approach work for large enterprise Power BI projects? A: Especially effective for large projects. Complex requirements benefit most from upfront visualization and stakeholder alignment.
Connect and Learn More
Ready to revolutionize your Power BI development process? The AI mockup approach isn’t just a time-saver—it’s a complete transformation in how you communicate with clients and deliver projects.
About the Author: Diana Ackermann, Power BI expert and statistician with 15+ years in business intelligence and data analysis.
Contact me